










Registration & Check-In
Registration will continue throughout the day.

Cancelling your registration will remove your access to the event. If you proceed, you will no longer be able to participate or access event-related materials.
Deleting your account will remove your access to the event.
Need Technical Assistance? ✉ tech@vfairs.com
October 14-15, 2026
Bismarck Event Center, Bismarck North Dakota
315 South 5th St, Bismarck ND
The North Dakota Geospatial Summit started out as GIS Day in 2001. In 2005 that event turned into the North Dakota GIS Users Conference. Reflecting the dynamic and widening geospatial field but not losing sight of the foundation continuing to be built upon by geospatial professionals, in 2019 the event was renamed to the North Dakota Geospatial Summit. The North Dakota Geospatial Summit is THE event in North Dakota for you if you can check one or more of these:
New! The 2026 Geospatial Summit will follow the October 11-13, 2026 North Dakota Association of Counties Conference. If you are planning to attend that conference, consider staying a bit longer and attend the Geospatial Summit!
Click on a tile for more information:

Director of Lands and Compliance, Metro Flood Diversion Authority
Justin Fisher, of West Fargo, North Dakota, joined the Metro Flood Diversion Authority as its Director of Lands and Compliance in June 2025. Prior to this role, Justin worked for multiple federal agencies, to include the USDA’s Natural Resources Conservation Service, U.S. Army Corps of Engineers and, most recently, the U.S. Department of Energy. Throughout these different roles, Justin has gained an extensive background in land management, real estate, and environmental compliance.
Join us in listening to Justin's presentation:
Seeing Beyond the Dirt: What Lies Ahead for the FM Diversion
The goal of reliable flood protection is at the center of the FM Area Diversion project. Years of planning, budgeting and permitting allowed this project to move from concept to construction. However, as the machinery moves offsite a new effort of work begins as we focus on operations, maintenance and environmental monitoring. This critical transition requires effective and efficient approaches that lend to GIS-centric efforts to visualize, track and analyze current and future efforts. These efforts involve tracking fish passage through aqueducts and associated features, levee and dam safety inspections, river geomorphology, forest and wetland mitigation, and native grass plantings across the 22-mile southern embankment.
Strategic Geospatial Advisor, GFT
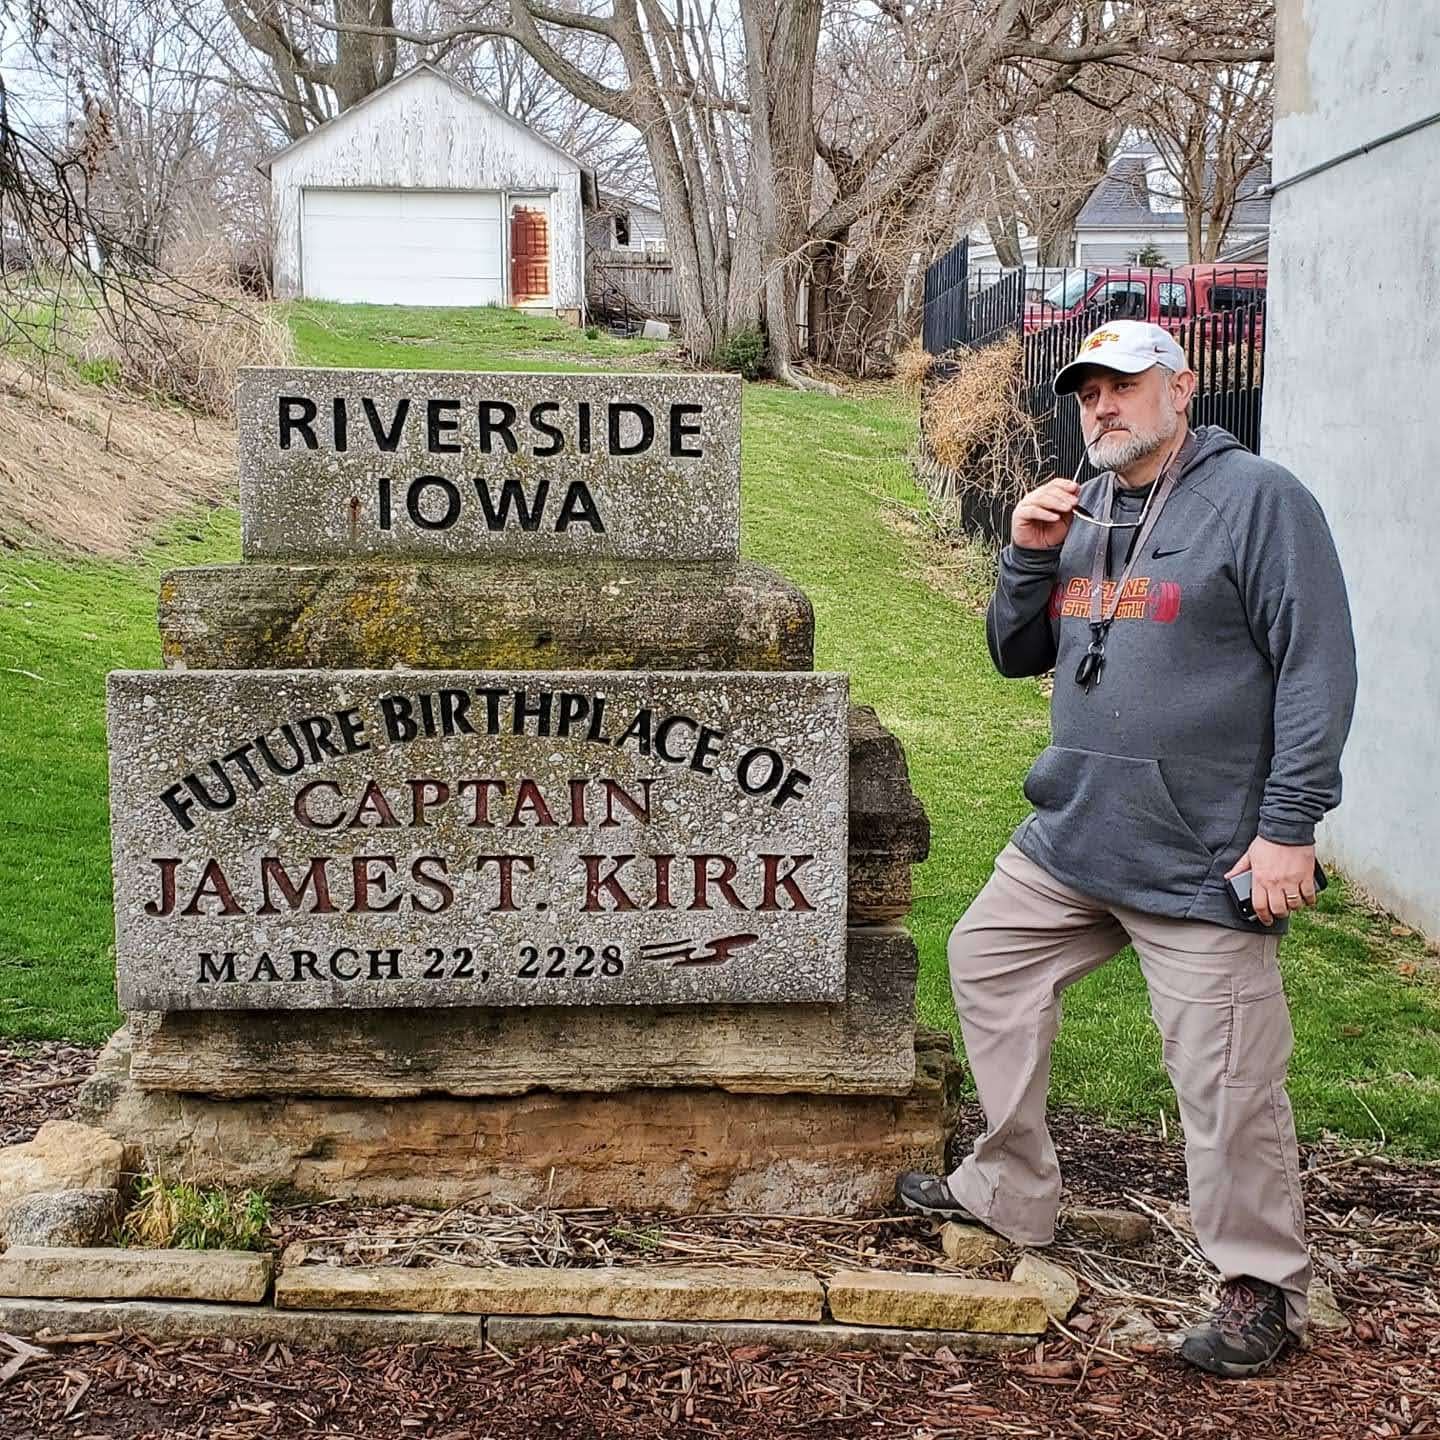
Eric Abrams brings 36 years of GIS and professional experience as Iowa DOT's Geographic Information Officer and, most recently, as a GIS and transportation subject matter expert at GFT. Eric draws on experience with technologies from Esri, FME, Vertigis, Oracle, and more, along with a deep understanding of government organizations and business processes, to help customers advance their GIS ecosystem and data integration by assessing an organization's GIS maturity, technology, and culture. Eric brings a unique perspective to GIS, data management, organizational culture, and how to get things done in the fast-paced, ever-changing GIS environment. As a side note, Eric and his wife run 4 retail stores with 65 employees, and Eric was elected to city council just to keep life busy.
Join us in listening to Eric's presentation:
Journey of a GIS Manager
Eric Abrams invites you on a fun and lighthearted journey through his 36 years of personal GIS experiences. From Iowa DOT GIO to consultant and entrepreneur, his story highlights trials, tribulations, and lessons learned that shape his view of today's and tomorrow's GIS landscape. In this lively, interactive session, Eric shares memorable experiences—and maybe some advice—about navigating budgets, government, technology, data, and organizational structures in pursuit of enterprise GIS utopia.

Bismarck State College's Automation, Energy, and Advanced Technologies Division
This is subject to change leading up to the Summit. Changes during the Summit will be announced during the Summit.
Here is a Schedule at a Glance (opens a PDF)
Here is the full Geospatial Program containing abstract information (opens a PDF)
* Use the Vfairs app to view the agenda and more. Scroll down for information. *
Registration will continue throughout the day.
The co-chairs will use this opportunity to open up the 2026 Geospatial Summit. We'll also take care of any housekeeping and announcements.
Our sponsors/exhibitors are an important part of the Summit! We invite you to take this time to speak with them. Ask questions, see what services they provide and exchange contact information to continue conversations after the Summit!
Session details and locations are in the session track for this scheduled time.
What is a conference without food! Pick up your box lunch and find a place to sit or stand if you are tired of sitting. If during registration you indicated any allergy or other food requirements, those should have been addressed.
Session details and locations are in the session track for this scheduled time.
In recognition of their Premier Sponsorship level, we invite these organizations to tell us a bit about the services they provide. In recognition of their Premier Sponsorship level, we are respectfully requesting your attendance at these presentations.
A bit about Frontier Precision: Frontier Precision is an employee-owned technology provider and systems integrator with over 38 years of experience bridging the gap between complex field data collection and enterprise-level execution across 22 states. We provide high-precision GNSS receivers, robotic total stations, UAS and robotics platforms, 3D reality capture systems, and utility locating and infrastructure monitoring solutions, backed by Esri Gold Partner status and Trimble Priority Support services. Our Trimble Certified Service Centers support surveying, mapping, construction, GIS, unmanned aircraft systems, utilities, forensics, agriculture, and natural resources professionals nationwide. What sets us apart is a human-centric focus: we know the real challenge isn't just buying a tool, it's ensuring field teams can capture data reliably, and office teams can process it effortlessly.
A bit about Fugro: Fugro is the world’s leading geo‑data specialist, delivering integrated data acquisition, remote sensing, and real‑time monitoring solutions that help clients understand subsurface and marine environments with precision. Leveraging advanced geophysical, geotechnical, and geospatial technologies, Fugro supports critical decisions across offshore wind, energy, infrastructure, and environmental projects. Their expertise spans marine and land site characterization, environmental and asset monitoring, and cutting‑edge uncrewed and remote operations that enhance safety, data quality, and operational efficiency.
Our sponsors/exhibitors are an important part of the Summit! We invite you to take this time to speak with them. Ask questions, see what services they provide and exchange contact information to continue conversations after the Summit!
Session details and locations are in the session track for this scheduled time.
After a day of presentations and information, by now your brain is probably getting overloaded from all of the content! Here's your chance to cool it down, but don't get a brain freeze! We plan to offer ice cream with toppings, and root beer floats, along with non-dairy and sugar-free options.
Be sure to check out these great ideas from the Bismarck-Mandan Convention & Visitors Bureau
Registration will be available most of the morning before closing.
We'll begin the day with reminders and announcements including any changes to the agenda.
If you haven't yet had a chance to visit with our sponsors/exhibitors, this is your last chance. These folks are an extremely important part of the Summit! We invite you to take this time to speak with them. Ask questions, see what services they provide and exchange contact information to continue conversations after the Summit!
Session details and locations are in the session track for this scheduled time.
The co-chairs will use this opportunity to wrap things up, including providing time to hear suggestions for improving the Geospatial Summit and providing more value to attendees and sponsors. And best of all, we plan to have the drawing for sponsor door prizes!
GeoAI is changing more than workflows. It's expanding what organizations can discover, understand, and accomplish with geographic information. From accelerating analysis and extracting insight from imagery to enabling natural language interaction with spatial data, GeoAI is opening new possibilities for GIS professionals and decision-makers alike. This session explores how GeoAI is enhancing spatial intelligence, improving situational awareness, and helping organizations move from data-rich to insight-driven. Through practical examples and emerging use cases, attendees will gain a framework for identifying where GeoAI can create meaningful impact and how to begin applying these capabilities within their own GIS programs.
This presentation will provide attendees with an update on the North Dakota Department of Water Resources’ geospatial activities and services over the past two years (since the last Summit). Participants will learn about key developments, enhancements, and changes to the Aerial Image Service, LiDAR Service, Survey Service, and Data Download Services. The session will highlight recent efforts to improve access to authoritative geospatial data, expand available resources, and enhance the tools and services used by agencies, professionals, and the public. Attendees will leave with a clearer understanding of current capabilities, recent updates, and what these changes mean for accessing and using North Dakota’s geospatial data resources.
The Williams County Highway department has been using out-of-date culvert data for the last several years. The data was collected originally by a consultant, was very expensive and had no way of being updated. They requested a newer way of collecting culverts that can be tracked and updated using GIS technology. The GIS department used ESRI’s Portal and Field Maps to create a form for culvert data collection. ESRI’s Arcade language was used to simplify collection on the form. A Dashboard was also built for the Highway Department Director to verify the accuracy of the data collection and to know which culverts need to be maintained. Using ArcGIS PRO, a report of all culverts collected was created as well.
Weed control is one of the biggest costs in agricultural crop production, and resistant weed species like Palmer amaranth and Waterhemp keep making it even harder. UAS technology is now being tested as a possible tool for finding and treating these weeds, but whether it actually earns a place in a working weed-management program is still an open question. This presentation brings together people working hands-on with the technology, drawing on an ongoing North Dakota Department of Agriculture effort using UAS to detect weeds in sugar beet and soybean fields across five counties. Presenters from Grand Farm, NDSU, the UAS industry will give their own honest read on where UAS for weed control stands today. The conversation will stay practical. What is actually working today, and what is still just a demo? Where are the real bottlenecks, whether that is detection accuracy, FAA rules, battery and payload limits, or turning imagery into action? Where is this headed over the next few years? And for a grower who wants to try it, what are the first concrete steps, and who should they be talking to? By the end, the audience should come away with a clear, field-tested picture of what UAS can and cannot do for weed control right now, and a realistic idea of how to get started if they decide it is worth it.
North Dakota’s prairie sits at the meeting point of three coupled subsystems (pothole surface water, grassland fire, and rangeland vegetation) whose interaction, rather than any single trend, governs how the landscape responds to a changing climate. Studying the three in isolation, or overlaying finished maps, cannot tell whether water loss, fire, and vegetation decline merely share ground or share a sequence. We developed the Coupled Surface-water–Fire–Vegetation (CSFV) framework, a sequence-aware integration implemented in Google Earth Engine, and applied it across North Dakota for 2000–2024. Each subsystem is mapped from the sensor best suited to it, reduced to aligned annual per-pixel series, and combined into a data-calibrated Ecosystem Instability Index that encodes lagged cross-subsystem coupling and critical-slowing-down early-warning signals. A Random Forest then attributes each pixel’s instability to a water-, fire-, vegetation-, compound-, or land-use-conversion cause. At the scale of the state the record is benign: open water showed no significant trend, vegetation greened (NDVI +0.0031 yr⁻¹), and active-fire counts declined (−79 yr⁻¹) even as fire stayed coupled to drought (r = −0.42 with SPEI). Beneath that aggregate, a per-pixel classification (0.935 overall accuracy, κ = 0.913) showed change dominated by land-use conversion and vegetation recovery, while the cross-subsystem coupling, near-zero statewide because fire reaches under a tenth of the rangeland, recovered to a leading predictor within the fire-exposed subset, where water loss leads fire and fire leads the failure to regreen. The resulting instability concentrates in a fire-coupled western band, spatially distinct from the eastern agricultural frontier...
The Statewide Parcel Dataset is the North Dakota GIS Hub’s most popular resource. This session offers value whether you’re just getting started or already using this dataset. Attending this session will provide background on how the dataset came to be, why it’s important for North Dakota, and provide a behind the scenes look at how it functions. You’ll also learn about the partners involved in maintaining it and the best ways to access the data. This presentation is tailored for a general audience of geospatial technology users.
The United States Geological Survey’s National Geospatial Program (NGP) provides foundational digital geospatial datasets, maps, and services representing the topography, natural landscape, and manmade environment of the U.S., free and publicly available through The National Map (TNM). Partnerships with state, county, Tribal, and other Federal agencies enable the acquisition of high-resolution elevation data through the 3D Elevation Program (3DEP), and the derivation of high-accuracy hydrography from that elevation data through the 3D Hydrography Program (3DHP). 3DEP and 3DHP data are published to TNM. This year, the North Dakota Department of Water Resources, the Natural Resources Conservation Service, and NGP partnered on a project to develop elevation-derived hydrography in two watersheds in north-central North Dakota. This data will be transformed into 3DHP and published on TNM within the next few years. NGP has recently updated the topoBuilder application, which lets users make custom maps, with new map styles and a new user interface. Updates on other TNM products and progress on current 3DEP and 3DHP projects will also be shared.
With over 150 miles of layflat hose in its network, West Dakota Water faced a challenge: limited visibility into the locations of critical assets. Learn about the suite of GIS solutions that transformed inventory management, delivering a comprehensive, real-time understanding of West Dakota Water's hose inventory from tracking reel locations and identifying hose sizes at each site to managing haulage activity and monitoring unused assets. We will also explore the ROI of these solutions, demonstrating how improved visibility has increased operational efficiency, reduced equipment loss and waste, and improved maintenance and replacement planning - making a tangible impact on operations.
High-resolution aerial imagery has become foundational infrastructure for local government. As more jurisdictions upgrade to 1-inch resolution, the opportunity shifts from acquisition to activation. This session examines how local governments are converting detailed imagery into automated GIS datasets that support compliance, revenue recovery, infrastructure planning, and emergency response. Through real-world examples, we’ll demonstrate how agencies are using automated extraction of impervious surfaces, sidewalks, building footprints, and land cover to modernize their base maps and reduce operational backlog. Learn how to move beyond pixels and leverage imagery as a growth engine for smarter, faster, and more defensible decision-making.
South Dakota has implemented a statewide geospatial analytics framework that fuses authoritative state and federal datasets to model real‑world first‑responder coverage using a standardized 15‑minute network‑based drive‑time analysis. The platform incorporates EMS incident data within an interactive dashboard environment that supports temporal, spatial, and categorical filtering of call records. A proximity‑based “Near Me” tool enables rapid identification and ranking of responder agencies by querying validated operational datasets and returning location and contact attributes. In addition, the system generates exportable, boundary‑driven analytical reports based on federal geographic units—such as municipal, county, legislative, and school district polygons—providing consistency for cross‑jurisdictional planning and interoperability. The architecture enhances statewide E911 operational efficiency by quantifying response gaps, supporting data‑driven resource allocation, and improving situational awareness across agencies. The resulting workflows offer a replicable model for integrating disparate emergency‑response datasets within a unified spatial environment. Esri has formally recognized the novelty of this approach and expressed interest in promoting the platform as a national and international exemplar of geospatial public‑health and emergency‑response integration.
Throughout U.S. history, population change patterns have varied significantly across different decades. This study examines county-level population change in all 50 states from 2000 to 2020. The first aim of this research is to map population change patterns from 2000 to 2020 and identify statistically significant hot and cold spots of county-level population change nationwide. This study uses Global Moran’s I to determine spatial autocorrelation for population change across US counties, while Anselin Local Moran’s I is used to identify local clusters and spatial outliers. The Getis-Ord Gi* hot spot analysis is further used to identify statistically significant hot and cold spots. This first part of the analysis identifies county-to-county population change patterns from 2000 to 2020. The second aim of this research study is to identify factors associated with this population change and analyze them to determine which are most significant. These factors will include different economic, climatic, presidential election voting patterns, and cost-of-living factors. An Ordinary Least Squares (OLS) regression will provide a baseline assessment of the relationship between these factors and population change patterns. A Spatial Error Model (SEM) and Spatial Lag Model (SLM) will then be conducted to account for spatial dependence where appropriate. This study is expected to identify significant patterns of county-level population change from 2000 to 2020 and determine the role of economic, climatic, political, and cost-of-living factors in this change.
The most effective organizations connect operational work, stakeholder collaboration, and public engagement into a single, coordinated approach. When information flows seamlessly across teams and communities, organizations can improve transparency, strengthen trust, and make better decisions. This session explores how GIS can support shared awareness, standardized processes, and meaningful collaboration across organizational boundaries. Through real-world examples, attendees will learn practical strategies for improving coordination, reducing communication gaps, and connecting day-to-day operations to measurable community outcomes.
McKenzie County Auditor partnered with GIS staff to develop election support resources.
Attend to find out how the McKenzie GIS Team met expectations.
Much like a picture is worth a thousand words, a dataset can make a thousand pictures. Join Stephanie and Jerame from the NDDOT as they show you how to turn your data into a masterpiece that will effectively tell your story. Using the magic of GIS, we will show you how to expertly weave a data- driven narrative that will inform and engage your audience.
Maps are essential tools for communicating scientific information, yet cartographic design is frequently overlooked during the scientific process. Even when a map presents accurate data, poor design choices can impede the final delivery and interpretation of results by diminishing, obscuring, or misrepresenting meaningful patterns and relationships. In contrast, strong cartographic design can transform complex spatial data into clear and actionable insights that support interpretation and facilitate decision-making. Drawing directly on real-world examples from the Energy & Environmental Research Center, this presentation will demonstrate how seemingly minor design choices determine whether specific maps effectively convey their intended message or purpose. Focusing primarily on North Dakota’s energy landscape and carbon capture, utilization, and storage development, with supplementary examples from across the United States, we will compare less-effective maps with proposed revisions to illustrate how particular design choices shape audience perception and interpretation of spatial patterns and relationships. Through these comparisons, we will examine how symbology, color, labeling, hierarchy, and composition can either reinforce or undermine a map’s intended message. Ultimately, cartographic design is more than aesthetics; it is a critical component of scientific communication. By designing maps with clarity and purpose, researchers and organizations can strategically convey scientific narratives and equip both internal and external stakeholders with accessible and actionable decision-making tools.
Research involves different specialties, datasets, and analytical needs. With ArcGIS Online (AGOL), GIS can move beyond communicating results to also support data exploration and decision-making throughout the research process. The Energy & Environmental Research Center (EERC) is a multidisciplinary research organization where geospatial information supports diverse projects. GIS no longer simply communicates the EERC’s final answers; it is becoming part of how its researchers arrive there. Previously, GIS at EERC centered on desktop analysis and static maps, but now it is expanding how researchers interact with spatial information. AGOL allows researchers to collaboratively validate data via web maps and applications that integrate disparate datasets into interactive environments, display data attributes and spatial relationships, perform proximity and buffer analyses, and iterate interim maps as research evolves. This expansion is not without challenges. The EERC has had to address new governance concerns around content management, user roles, credits, data reliability amid personnel and responsibility changes and overlapping projects, and reviewing, retiring, and archiving outdated resources. This presentation will explore how the EERC is using AGOL’s capabilities to augment traditional static GIS products to improve research. The discussion will highlight how this secure internal web GIS environment can help multidisciplinary teams augment conventional GIS to investigate, understand, and visualize their data, supporting faster decisions and more informed, trusted research.
The Forest River watershed is an approximately 936 square miles agricultural tributary of the Red River of the North in eastern North Dakota. The watershed transitions from moderately sloping glaciated plain in the west, with a low relief former Lake Agassiz plain of the Red River Valley in the east, providing useful setting for examine the relationship among terrain, surface runoff and potential erosion. The study also looked at changes in historic flow regimes for the Forest River. Using an approximately 9m resolution digital elevation model (DEM), GIS-based terrain analyses were conducted in ArcGIS Pro, including slope, D8 flow direction, flow accumulation, higher order drainage pathways, and Stream Power Index (SPI). SPI is a terrain-based index that combines contributing flow accumulation and slope to represent the potential erosive power of concentrated surface runoff. Percentile-based classification produced 85th, 90th and 95th percentile SPI thresholds of 2.898, 3.624 and 4.865 respectively. Locations at or above the 95th percentile were considered to be the highest erosion potential areas. Approximately 68.2% of these areas occurred in Walsh County, followed by Grand Forks County (23.1%), Nelson County (8.4%), and Cavalier County (0.3%). The results were compared to previous SPI research conducted by Thalacker (2014) in the Forest River system. This difference could be due to the resolution of the DEM, the area of the watersheds and the preprocessing methods. The study illustrates the use of GIS-based terrain analysis to determine priority areas for field verification, monitoring erosion and planning conservation in the agricultural watershed.
Harmful algal blooms (HABs) are an increasing concern for freshwater systems and require monitoring approaches capable of capturing changes across both space and time. This research evaluates the use of Harmonized Landsat and Sentinel-2 (HLS) satellite imagery to monitor algal conditions in four North Dakota water bodies: Devils Lake, Stump Lake, Larimore Dam, and Homme Dam. In-situ water samples are collected during the open-water season and analyzed for chlorophyll-a and phycocyanin, which serve as indicators of algal and cyanobacterial abundance. These field measurements are paired with satellite imagery acquired near sampling dates to examine relationships between measured water-quality conditions and satellite-derived spectral information. Google Earth Engine is used to acquire, process, and analyze HLS imagery and develop a repeatable workflow for monitoring water quality. Spectral indices and reflectance information will be compared with field measurements to evaluate their ability to identify elevated algal concentrations and potential bloom areas. GIS and time-series analyses will further be used to examine the spatial distribution, development, and persistence of algal conditions. This research aims to demonstrate how satellite remote sensing can complement traditional field sampling and improve monitoring of harmful algal blooms in North Dakota lakes.
ND Roads is one of the flagship GIS web applications in the State of North Dakota that communicates road conditions to the public. The web application was developed prior to the recent Department of Justice ruling that requires all government agencies to ensure web applications are compliant with the WCAG 2.1 standard. This presentation will provide an overview of the process used to assess and remediate the NDRoads web application to conform to the standard. Specifically focusing on the GIS features within the web application. We will share some lessons learned along the way and critical decision points.
The Americans with Disability Act or ADA, was signed into law in 1990 by President George Bush. In 1996, the U.S. Department of Justice interpreted that the ADA includes websites and mobile devices. Despite that ruling, digital accessibility compliance had been lagging or non-existent -until recently. In 2024 the DOJ issued a final rule and timeline for states and local governments to bring their digital presence into compliance. The compliance date for state governments has now been pushed back to April 26, 2027 (or April 26, 2028, for public entities with total population less than 50,000 or special district governments). What is digital accessibility, what does it mean for a GIS professional and the web maps they create for their organization? This special panel will provide three perspectives on why accessibility matters and the importance of digital accessibility specific to geospatial information. The first perspective is from a former state agency GIS Coordinator who is now external civil rights program manager responsible for compliance and investigating complaints of discrimination; North Dakota Department of Transportation’s journey to implementing digital accessibility in their digital geospatial products; and finally a geospatial professional in Minnesota working closely with their state’s Office of Accessibility will share how coordination and cooperation have led to increased adaption of accessibility standards and expectations for state and local governments.
A GIS mapping tool was created to comply with the Federal National Environmental Policy Act (NEPA) permitting requirements for a 150-mile rural water project that crossed 50 miles of the Little Missouri National Grassland. The GIS tool allows for real time collaboration with all project stakeholders and streamlined the navigation of waterline design and installation through cultural resource areas and sensitive wildlife habitats.
Every infrastructure project requires some type of property right. Property acquisition generates volumes of spatial and tabular data, documents, drawings, and exhibits. Property information is often managed as a short-term project deliverable rather than a long-term organizational asset. This presentation takes us on a journey through the lifecycle of parcel data, from project location decisions, to initial rights of entry, through property acquisition processes and finally migration to an archivable yet living dataset which can be referenced for future maintenance and project operation. Attendees will learn how GIS is used as the foundation for integrating ownership records, appraisal data, acquisitions and property rights into a single authoritative source of information. The GIS data needs to be accessible to multiple levels of participants in the project’s day-to-day operations, and maintenance will continue in one form or another for generations. The project’s long lifespan introduces complex challenges that are best addressed through the broad range of solutions GIS provides.
North Dakota agencies manage large, dispersed land portfolios, infrastructure, and natural resources while working within short field seasons and limited staff capacity. This session will show how North Dakota Game and Fish (NDGF) is using Lens (a remote monitoring platform) alongside existing GIS resources to make land monitoring more targeted, scaleable, and actionable. In addition to sharing more about NDGF's use of change detection tools to support the Private Lands Open to Sportsmen (PLOTS) program, Upstream Tech will cover other ways that agencies are using aerial imagery and change detection to help prioritize inspections, evaluate land-use changes and grazing, understand forest trends, monitor Wildlife Management Areas, and more. The session will also discuss recent breakthroughs in AI that have proven useful for monitoring vast landscapes and uncovering insights about land management practices. Topics include compatibility with QGIS; usage of AI for change detection and insight collection; combining public and commercial imagery; and using automated alerts, notes, and reports to direct limited staff capacity toward the highest-priority sites. Attendees will leave with a practical framework for extending existing GIS investments into an operational remote-monitoring workflow that improves statewide oversight while keeping field expertise central.
Registration will continue throughout the day.
The co-chairs will use this opportunity to open up the 2026 Geospatial Summit. We'll also take care of any housekeeping and announcements.
Justin Fisher
Director of Lands and Compliance, Metro Flood Diversion Authority
Justin Fisher, of West Fargo, North Dakota, joined the Metro Flood Diversion Authority as its Director of Lands and Compliance in June 2025. Prior to this role, Justin worked for multiple federal agencies, to include the USDA’s Natural Resources Conservation Service, U.S. Army Corps of Engineers and, most recently, the U.S. Department of Energy. Throughout these different roles, Justin has gained an extensive background in land management, real estate, and environmental compliance.
Join us in listening to Justin's presentation:
Seeing Beyond the Dirt: What Lies Ahead for the FM Diversion
The goal of reliable flood protection is at the center of the FM Area Diversion project. Years of planning, budgeting and permitting allowed this project to move from concept to construction. However, as the machinery moves offsite a new effort of work begins as we focus on operations, maintenance and environmental monitoring. This critical transition requires effective and efficient approaches that lend to GIS-centric efforts to visualize, track and analyze current and future efforts. These efforts involve tracking fish passage through aqueducts and associated features, levee and dam safety inspections, river geomorphology, forest and wetland mitigation, and native grass plantings across the 22-mile southern embankment.
Our sponsors/exhibitors are an important part of the Summit! We invite you to take this time to speak with them. Ask questions, see what services they provide and exchange contact information to continue conversations after the Summit!
Session details and locations are in the session track for this scheduled time.
What is a conference without food! Pick up your box lunch and find a place to sit or stand if you are tired of sitting. If during registration you indicated any allergy or other food requirements, those should have been addressed.
Session details and locations are in the session track for this scheduled time.
In recognition of their Premier Sponsorship level, we invite these organizations to tell us a bit about the services they provide. In recognition of their Premier Sponsorship level, we are respectfully requesting your attendance at these presentations.
A bit about Frontier Precision: Frontier Precision is an employee-owned technology provider and systems integrator with over 38 years of experience bridging the gap between complex field data collection and enterprise-level execution across 22 states. We provide high-precision GNSS receivers, robotic total stations, UAS and robotics platforms, 3D reality capture systems, and utility locating and infrastructure monitoring solutions, backed by Esri Gold Partner status and Trimble Priority Support services. Our Trimble Certified Service Centers support surveying, mapping, construction, GIS, unmanned aircraft systems, utilities, forensics, agriculture, and natural resources professionals nationwide. What sets us apart is a human-centric focus: we know the real challenge isn't just buying a tool, it's ensuring field teams can capture data reliably, and office teams can process it effortlessly.
A bit about Fugro: Fugro is the world’s leading geo‑data specialist, delivering integrated data acquisition, remote sensing, and real‑time monitoring solutions that help clients understand subsurface and marine environments with precision. Leveraging advanced geophysical, geotechnical, and geospatial technologies, Fugro supports critical decisions across offshore wind, energy, infrastructure, and environmental projects. Their expertise spans marine and land site characterization, environmental and asset monitoring, and cutting‑edge uncrewed and remote operations that enhance safety, data quality, and operational efficiency.
Our sponsors/exhibitors are an important part of the Summit! We invite you to take this time to speak with them. Ask questions, see what services they provide and exchange contact information to continue conversations after the Summit!
Session details and locations are in the session track for this scheduled time.
After a day of presentations and information, by now your brain is probably getting overloaded from all of the content! Here's your chance to cool it down, but don't get a brain freeze! We plan to offer ice cream with toppings, and root beer floats, along with non-dairy and sugar-free options.
Be sure to check out these great ideas from the Bismarck-Mandan Convention & Visitors Bureau
Registration will be available most of the morning before closing.
We'll begin the day with reminders and announcements including any changes to the agenda.
Eric Abrams
Strategic Geospatial Advisor, GFT
Eric Abrams brings 36 years of GIS and professional experience as Iowa DOT's Geographic Information Officer and, most recently, as a GIS and transportation subject matter expert at GFT. Eric draws on experience with technologies from Esri, FME, Vertigis, Oracle, and more, along with a deep understanding of government organizations and business processes, to help customers advance their GIS ecosystem and data integration by assessing an organization's GIS maturity, technology, and culture. Eric brings a unique perspective to GIS, data management, organizational culture, and how to get things done in the fast-paced, ever-changing GIS environment. As a side note, Eric and his wife run 4 retail stores with 65 employees, and Eric was elected to city council just to keep life busy.
Join us in listening to Eric's presentation:
Journey of a GIS Manager
Eric Abrams invites you on a fun and lighthearted journey through his 36 years of personal GIS experiences. From Iowa DOT GIO to consultant and entrepreneur, his story highlights trials, tribulations, and lessons learned that shape his view of today's and tomorrow's GIS landscape. In this lively, interactive session, Eric shares memorable experiences—and maybe some advice—about navigating budgets, government, technology, data, and organizational structures in pursuit of enterprise GIS utopia.
If you haven't yet had a chance to visit with our sponsors/exhibitors, this is your last chance. These folks are an extremely important part of the Summit! We invite you to take this time to speak with them. Ask questions, see what services they provide and exchange contact information to continue conversations after the Summit!
Session details and locations are in the session track for this scheduled time.
The co-chairs will use this opportunity to wrap things up, including providing time to hear suggestions for improving the Geospatial Summit and providing more value to attendees and sponsors. And best of all, we plan to have the drawing for sponsor door prizes!
GeoAI is changing more than workflows. It's expanding what organizations can discover, understand, and accomplish with geographic information. From accelerating analysis and extracting insight from imagery to enabling natural language interaction with spatial data, GeoAI is opening new possibilities for GIS professionals and decision-makers alike. This session explores how GeoAI is enhancing spatial intelligence, improving situational awareness, and helping organizations move from data-rich to insight-driven. Through practical examples and emerging use cases, attendees will gain a framework for identifying where GeoAI can create meaningful impact and how to begin applying these capabilities within their own GIS programs.
Phillip Julian
Esri
Esri
This presentation will provide attendees with an update on the North Dakota Department of Water Resources’ geospatial activities and services over the past two years (since the last Summit). Participants will learn about key developments, enhancements, and changes to the Aerial Image Service, LiDAR Service, Survey Service, and Data Download Services. The session will highlight recent efforts to improve access to authoritative geospatial data, expand available resources, and enhance the tools and services used by agencies, professionals, and the public. Attendees will leave with a clearer understanding of current capabilities, recent updates, and what these changes mean for accessing and using North Dakota’s geospatial data resources.
Mark Steele
North Dakota Department of Water Resources
The Williams County Highway department has been using out-of-date culvert data for the last several years. The data was collected originally by a consultant, was very expensive and had no way of being updated. They requested a newer way of collecting culverts that can be tracked and updated using GIS technology. The GIS department used ESRI’s Portal and Field Maps to create a form for culvert data collection. ESRI’s Arcade language was used to simplify collection on the form. A Dashboard was also built for the Highway Department Director to verify the accuracy of the data collection and to know which culverts need to be maintained. Using ArcGIS PRO, a report of all culverts collected was created as well.
Ryan Miles
Williams County
Williams County
Weed control is one of the biggest costs in agricultural crop production, and resistant weed species like Palmer amaranth and Waterhemp keep making it even harder. UAS technology is now being tested as a possible tool for finding and treating these weeds, but whether it actually earns a place in a working weed-management program is still an open question. This presentation brings together people working hands-on with the technology, drawing on an ongoing North Dakota Department of Agriculture effort using UAS to detect weeds in sugar beet and soybean fields across five counties. Presenters from Grand Farm, NDSU, the UAS industry will give their own honest read on where UAS for weed control stands today. The conversation will stay practical. What is actually working today, and what is still just a demo? Where are the real bottlenecks, whether that is detection accuracy, FAA rules, battery and payload limits, or turning imagery into action? Where is this headed over the next few years? And for a grower who wants to try it, what are the first concrete steps, and who should they be talking to? By the end, the audience should come away with a clear, field-tested picture of what UAS can and cannot do for weed control right now, and a realistic idea of how to get started if they decide it is worth it.
David Vinson
Grand Farm
Grand Farm
Arjun Upadhyay
North Dakota State University
Kyle Bloomquist
iSight Drone Services
North Dakota’s prairie sits at the meeting point of three coupled subsystems (pothole surface water, grassland fire, and rangeland vegetation) whose interaction, rather than any single trend, governs how the landscape responds to a changing climate. Studying the three in isolation, or overlaying finished maps, cannot tell whether water loss, fire, and vegetation decline merely share ground or share a sequence. We developed the Coupled Surface-water–Fire–Vegetation (CSFV) framework, a sequence-aware integration implemented in Google Earth Engine, and applied it across North Dakota for 2000–2024. Each subsystem is mapped from the sensor best suited to it, reduced to aligned annual per-pixel series, and combined into a data-calibrated Ecosystem Instability Index that encodes lagged cross-subsystem coupling and critical-slowing-down early-warning signals. A Random Forest then attributes each pixel’s instability to a water-, fire-, vegetation-, compound-, or land-use-conversion cause. At the scale of the state the record is benign: open water showed no significant trend, vegetation greened (NDVI +0.0031 yr⁻¹), and active-fire counts declined (−79 yr⁻¹) even as fire stayed coupled to drought (r = −0.42 with SPEI). Beneath that aggregate, a per-pixel classification (0.935 overall accuracy, κ = 0.913) showed change dominated by land-use conversion and vegetation recovery, while the cross-subsystem coupling, near-zero statewide because fire reaches under a tenth of the rangeland, recovered to a leading predictor within the fire-exposed subset, where water loss leads fire and fire leads the failure to regreen. The resulting instability concentrates in a fire-coupled western band, spatially distinct from the eastern agricultural frontier...
Mbongowo Mbuh
University of North Dakota
Md Nasifur Rahman Sakib
University of North Dakota
Gregory Vandeberg
University of North Dakota
The Statewide Parcel Dataset is the North Dakota GIS Hub’s most popular resource. This session offers value whether you’re just getting started or already using this dataset. Attending this session will provide background on how the dataset came to be, why it’s important for North Dakota, and provide a behind the scenes look at how it functions. You’ll also learn about the partners involved in maintaining it and the best ways to access the data. This presentation is tailored for a general audience of geospatial technology users.
Bob Nutsch
Moderator
North Dakota Information Technology
The United States Geological Survey’s National Geospatial Program (NGP) provides foundational digital geospatial datasets, maps, and services representing the topography, natural landscape, and manmade environment of the U.S., free and publicly available through The National Map (TNM). Partnerships with state, county, Tribal, and other Federal agencies enable the acquisition of high-resolution elevation data through the 3D Elevation Program (3DEP), and the derivation of high-accuracy hydrography from that elevation data through the 3D Hydrography Program (3DHP). 3DEP and 3DHP data are published to TNM. This year, the North Dakota Department of Water Resources, the Natural Resources Conservation Service, and NGP partnered on a project to develop elevation-derived hydrography in two watersheds in north-central North Dakota. This data will be transformed into 3DHP and published on TNM within the next few years. NGP has recently updated the topoBuilder application, which lets users make custom maps, with new map styles and a new user interface. Updates on other TNM products and progress on current 3DEP and 3DHP projects will also be shared.
Elaine Guidero
U.S. Geological Survey
With over 150 miles of layflat hose in its network, West Dakota Water faced a challenge: limited visibility into the locations of critical assets. Learn about the suite of GIS solutions that transformed inventory management, delivering a comprehensive, real-time understanding of West Dakota Water's hose inventory from tracking reel locations and identifying hose sizes at each site to managing haulage activity and monitoring unused assets. We will also explore the ROI of these solutions, demonstrating how improved visibility has increased operational efficiency, reduced equipment loss and waste, and improved maintenance and replacement planning - making a tangible impact on operations.
Alisha Becker
Pro-West & Associates
Alex Lange
Pro-West & Associates
High-resolution aerial imagery has become foundational infrastructure for local government. As more jurisdictions upgrade to 1-inch resolution, the opportunity shifts from acquisition to activation. This session examines how local governments are converting detailed imagery into automated GIS datasets that support compliance, revenue recovery, infrastructure planning, and emergency response. Through real-world examples, we’ll demonstrate how agencies are using automated extraction of impervious surfaces, sidewalks, building footprints, and land cover to modernize their base maps and reduce operational backlog. Learn how to move beyond pixels and leverage imagery as a growth engine for smarter, faster, and more defensible decision-making.
Porter Sartor
EagleView Technologies
South Dakota has implemented a statewide geospatial analytics framework that fuses authoritative state and federal datasets to model real‑world first‑responder coverage using a standardized 15‑minute network‑based drive‑time analysis. The platform incorporates EMS incident data within an interactive dashboard environment that supports temporal, spatial, and categorical filtering of call records. A proximity‑based “Near Me” tool enables rapid identification and ranking of responder agencies by querying validated operational datasets and returning location and contact attributes. In addition, the system generates exportable, boundary‑driven analytical reports based on federal geographic units—such as municipal, county, legislative, and school district polygons—providing consistency for cross‑jurisdictional planning and interoperability. The architecture enhances statewide E911 operational efficiency by quantifying response gaps, supporting data‑driven resource allocation, and improving situational awareness across agencies. The resulting workflows offer a replicable model for integrating disparate emergency‑response datasets within a unified spatial environment. Esri has formally recognized the novelty of this approach and expressed interest in promoting the platform as a national and international exemplar of geospatial public‑health and emergency‑response integration.
Jeremiah Maxfield
State of South Dakota
Throughout U.S. history, population change patterns have varied significantly across different decades. This study examines county-level population change in all 50 states from 2000 to 2020. The first aim of this research is to map population change patterns from 2000 to 2020 and identify statistically significant hot and cold spots of county-level population change nationwide. This study uses Global Moran’s I to determine spatial autocorrelation for population change across US counties, while Anselin Local Moran’s I is used to identify local clusters and spatial outliers. The Getis-Ord Gi* hot spot analysis is further used to identify statistically significant hot and cold spots. This first part of the analysis identifies county-to-county population change patterns from 2000 to 2020. The second aim of this research study is to identify factors associated with this population change and analyze them to determine which are most significant. These factors will include different economic, climatic, presidential election voting patterns, and cost-of-living factors. An Ordinary Least Squares (OLS) regression will provide a baseline assessment of the relationship between these factors and population change patterns. A Spatial Error Model (SEM) and Spatial Lag Model (SLM) will then be conducted to account for spatial dependence where appropriate. This study is expected to identify significant patterns of county-level population change from 2000 to 2020 and determine the role of economic, climatic, political, and cost-of-living factors in this change.
Daniel Lureen
University of North Dakota
The most effective organizations connect operational work, stakeholder collaboration, and public engagement into a single, coordinated approach. When information flows seamlessly across teams and communities, organizations can improve transparency, strengthen trust, and make better decisions. This session explores how GIS can support shared awareness, standardized processes, and meaningful collaboration across organizational boundaries. Through real-world examples, attendees will learn practical strategies for improving coordination, reducing communication gaps, and connecting day-to-day operations to measurable community outcomes.
Phillip Julian
Esri
Esri
McKenzie County Auditor partnered with GIS staff to develop election support resources.
Attend to find out how the McKenzie GIS Team met expectations.
Bonnie Foster
GIS Coordinator, McKenzie County Public Works
Much like a picture is worth a thousand words, a dataset can make a thousand pictures. Join Stephanie and Jerame from the NDDOT as they show you how to turn your data into a masterpiece that will effectively tell your story. Using the magic of GIS, we will show you how to expertly weave a data- driven narrative that will inform and engage your audience.
Stephanie Weiand
North Dakota Department of Transportation
Jerame Novak
Moderator
North Dakota Department of Transportation
Maps are essential tools for communicating scientific information, yet cartographic design is frequently overlooked during the scientific process. Even when a map presents accurate data, poor design choices can impede the final delivery and interpretation of results by diminishing, obscuring, or misrepresenting meaningful patterns and relationships. In contrast, strong cartographic design can transform complex spatial data into clear and actionable insights that support interpretation and facilitate decision-making. Drawing directly on real-world examples from the Energy & Environmental Research Center, this presentation will demonstrate how seemingly minor design choices determine whether specific maps effectively convey their intended message or purpose. Focusing primarily on North Dakota’s energy landscape and carbon capture, utilization, and storage development, with supplementary examples from across the United States, we will compare less-effective maps with proposed revisions to illustrate how particular design choices shape audience perception and interpretation of spatial patterns and relationships. Through these comparisons, we will examine how symbology, color, labeling, hierarchy, and composition can either reinforce or undermine a map’s intended message. Ultimately, cartographic design is more than aesthetics; it is a critical component of scientific communication. By designing maps with clarity and purpose, researchers and organizations can strategically convey scientific narratives and equip both internal and external stakeholders with accessible and actionable decision-making tools.
Hayden Yates
University of North Dakota Energy & Environmental Research Center
Kripa Thapa
University of North Dakota Energy & Environmental Research Center
Zahra Finnigan
University of North Dakota Energy & Environmental Research Center
Research involves different specialties, datasets, and analytical needs. With ArcGIS Online (AGOL), GIS can move beyond communicating results to also support data exploration and decision-making throughout the research process. The Energy & Environmental Research Center (EERC) is a multidisciplinary research organization where geospatial information supports diverse projects. GIS no longer simply communicates the EERC’s final answers; it is becoming part of how its researchers arrive there. Previously, GIS at EERC centered on desktop analysis and static maps, but now it is expanding how researchers interact with spatial information. AGOL allows researchers to collaboratively validate data via web maps and applications that integrate disparate datasets into interactive environments, display data attributes and spatial relationships, perform proximity and buffer analyses, and iterate interim maps as research evolves. This expansion is not without challenges. The EERC has had to address new governance concerns around content management, user roles, credits, data reliability amid personnel and responsibility changes and overlapping projects, and reviewing, retiring, and archiving outdated resources. This presentation will explore how the EERC is using AGOL’s capabilities to augment traditional static GIS products to improve research. The discussion will highlight how this secure internal web GIS environment can help multidisciplinary teams augment conventional GIS to investigate, understand, and visualize their data, supporting faster decisions and more informed, trusted research.
Kripa Thapa
University of North Dakota Energy & Environmental Research Center
Hayden Yates
University of North Dakota Energy & Environmental Research Center
Zahra Finnigan
University of North Dakota Energy & Environmental Research Center
The Forest River watershed is an approximately 936 square miles agricultural tributary of the Red River of the North in eastern North Dakota. The watershed transitions from moderately sloping glaciated plain in the west, with a low relief former Lake Agassiz plain of the Red River Valley in the east, providing useful setting for examine the relationship among terrain, surface runoff and potential erosion. The study also looked at changes in historic flow regimes for the Forest River. Using an approximately 9m resolution digital elevation model (DEM), GIS-based terrain analyses were conducted in ArcGIS Pro, including slope, D8 flow direction, flow accumulation, higher order drainage pathways, and Stream Power Index (SPI). SPI is a terrain-based index that combines contributing flow accumulation and slope to represent the potential erosive power of concentrated surface runoff. Percentile-based classification produced 85th, 90th and 95th percentile SPI thresholds of 2.898, 3.624 and 4.865 respectively. Locations at or above the 95th percentile were considered to be the highest erosion potential areas. Approximately 68.2% of these areas occurred in Walsh County, followed by Grand Forks County (23.1%), Nelson County (8.4%), and Cavalier County (0.3%). The results were compared to previous SPI research conducted by Thalacker (2014) in the Forest River system. This difference could be due to the resolution of the DEM, the area of the watersheds and the preprocessing methods. The study illustrates the use of GIS-based terrain analysis to determine priority areas for field verification, monitoring erosion and planning conservation in the agricultural watershed.
Gregory Vandeberg
University of North Dakota
Sheena Ofori
University of North Dakota
Harmful algal blooms (HABs) are an increasing concern for freshwater systems and require monitoring approaches capable of capturing changes across both space and time. This research evaluates the use of Harmonized Landsat and Sentinel-2 (HLS) satellite imagery to monitor algal conditions in four North Dakota water bodies: Devils Lake, Stump Lake, Larimore Dam, and Homme Dam. In-situ water samples are collected during the open-water season and analyzed for chlorophyll-a and phycocyanin, which serve as indicators of algal and cyanobacterial abundance. These field measurements are paired with satellite imagery acquired near sampling dates to examine relationships between measured water-quality conditions and satellite-derived spectral information. Google Earth Engine is used to acquire, process, and analyze HLS imagery and develop a repeatable workflow for monitoring water quality. Spectral indices and reflectance information will be compared with field measurements to evaluate their ability to identify elevated algal concentrations and potential bloom areas. GIS and time-series analyses will further be used to examine the spatial distribution, development, and persistence of algal conditions. This research aims to demonstrate how satellite remote sensing can complement traditional field sampling and improve monitoring of harmful algal blooms in North Dakota lakes.
Zachary Ahrenstorff
University of North Dakota
ND Roads is one of the flagship GIS web applications in the State of North Dakota that communicates road conditions to the public. The web application was developed prior to the recent Department of Justice ruling that requires all government agencies to ensure web applications are compliant with the WCAG 2.1 standard. This presentation will provide an overview of the process used to assess and remediate the NDRoads web application to conform to the standard. Specifically focusing on the GIS features within the web application. We will share some lessons learned along the way and critical decision points.
Brian Fischer
Houston Engineering, Inc.
Brandon Backman
North Dakota Information Technology
The Americans with Disability Act or ADA, was signed into law in 1990 by President George Bush. In 1996, the U.S. Department of Justice interpreted that the ADA includes websites and mobile devices. Despite that ruling, digital accessibility compliance had been lagging or non-existent -until recently. In 2024 the DOJ issued a final rule and timeline for states and local governments to bring their digital presence into compliance. The compliance date for state governments has now been pushed back to April 26, 2027 (or April 26, 2028, for public entities with total population less than 50,000 or special district governments). What is digital accessibility, what does it mean for a GIS professional and the web maps they create for their organization? This special panel will provide three perspectives on why accessibility matters and the importance of digital accessibility specific to geospatial information. The first perspective is from a former state agency GIS Coordinator who is now external civil rights program manager responsible for compliance and investigating complaints of discrimination; North Dakota Department of Transportation’s journey to implementing digital accessibility in their digital geospatial products; and finally a geospatial professional in Minnesota working closely with their state’s Office of Accessibility will share how coordination and cooperation have led to increased adaption of accessibility standards and expectations for state and local governments.
Ann Fritz
Moderator
North Dakota Department of Environmental Quality
Stephanie Weiand
North Dakota Department of Transportation
Jerame Novak
NDDOT
NDDOT
Jason Ewert
MN Information Technology-MPCA
A GIS mapping tool was created to comply with the Federal National Environmental Policy Act (NEPA) permitting requirements for a 150-mile rural water project that crossed 50 miles of the Little Missouri National Grassland. The GIS tool allows for real time collaboration with all project stakeholders and streamlined the navigation of waterline design and installation through cultural resource areas and sensitive wildlife habitats.
Dan Lissick
AE2S
AE2S
Every infrastructure project requires some type of property right. Property acquisition generates volumes of spatial and tabular data, documents, drawings, and exhibits. Property information is often managed as a short-term project deliverable rather than a long-term organizational asset. This presentation takes us on a journey through the lifecycle of parcel data, from project location decisions, to initial rights of entry, through property acquisition processes and finally migration to an archivable yet living dataset which can be referenced for future maintenance and project operation. Attendees will learn how GIS is used as the foundation for integrating ownership records, appraisal data, acquisitions and property rights into a single authoritative source of information. The GIS data needs to be accessible to multiple levels of participants in the project’s day-to-day operations, and maintenance will continue in one form or another for generations. The project’s long lifespan introduces complex challenges that are best addressed through the broad range of solutions GIS provides.
Carol Wickenheiser
Moderator
AE2S
AE2S
North Dakota agencies manage large, dispersed land portfolios, infrastructure, and natural resources while working within short field seasons and limited staff capacity. This session will show how North Dakota Game and Fish (NDGF) is using Lens (a remote monitoring platform) alongside existing GIS resources to make land monitoring more targeted, scaleable, and actionable. In addition to sharing more about NDGF's use of change detection tools to support the Private Lands Open to Sportsmen (PLOTS) program, Upstream Tech will cover other ways that agencies are using aerial imagery and change detection to help prioritize inspections, evaluate land-use changes and grazing, understand forest trends, monitor Wildlife Management Areas, and more. The session will also discuss recent breakthroughs in AI that have proven useful for monitoring vast landscapes and uncovering insights about land management practices. Topics include compatibility with QGIS; usage of AI for change detection and insight collection; combining public and commercial imagery; and using automated alerts, notes, and reports to direct limited staff capacity toward the highest-priority sites. Attendees will leave with a practical framework for extending existing GIS investments into an operational remote-monitoring workflow that improves statewide oversight while keeping field expertise central.
Miles van Blarcum
Upstream Tech
Upstream Tech
Download the Geospatial Summit App
This is the vFairs Unified App that you can install on your mobile device to view the agenda, exhibitors, sponsors and build your own schedule.


Bismarck Event Center
315 South 5th St, Bismarck ND
Prairie Rose Rooms (Upper Level - Exhibit Hall Entrance Door E42)



Owners, C-Level, VP-Level, Engineers, Legal, R&D, Patent/Small Business Attorneys, Finance & Venture Capital
Gain access to top-tier federal partners and insight into technology transfer, autonomy, and space-aligned SBIR programs.
Connect with officials from DoD, DOE, NSF, and other agencies seeking innovators and dual-use collaborators. If you think all the opportunities are in Texas and California — think again. Grand Forks is a growing hub for space innovation.
Presidents, Chancellors, VPRs, Tech Transfer Officers, Researchers
Academia - Why Attend?
Explore federal funding pipelines, network with mission-aligned agencies, and connect with entrepreneurs and startups ready to collaborate. From CHIPS Act partnerships to federal grant access, SOS is a launchpad for institutions looking to plug into the national space and tech economy.
Federal, State & Local Policymakers, Program Officers, Incentive Managers, Economic Development Professionals
Government - Why Attend?
Meet the engineers, entrepreneurs, and researchers shaping North Dakota’s space future. Learn how to drive economic growth while fulfilling Congressional mandates.
UND and its innovation partners are creating a nationally relevant ecosystem and government agencies are invited to engage directly with on-the-ground change-makers.
A showcase of stunning visuals in one place.
Tell your event story through images